Tutorials / Output
LED bar
A row of 2 to 16 LEDs, one GPIO each — the level meter of every stereo.
- LED bar
- Potentiometer
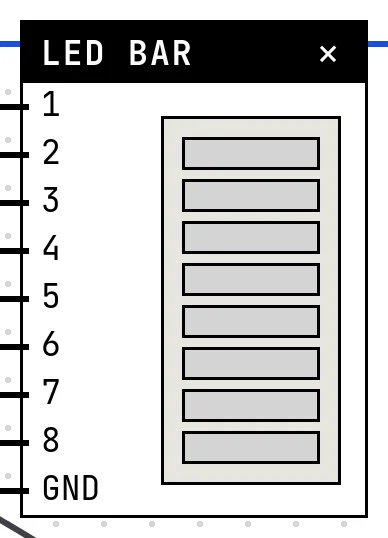
What it is
A bar-graph display is a row of LEDs in one package, each with its own anode and a common cathode. Light the first n of them and you have a level meter: volume, battery, temperature — any quantity that is easier to glance at than to read.
In the simulator
The block shows one segment per LED, numbered from 1. The Number of LEDs setting (2 to 16) changes the block's pins: each segment is a signal pin, plus one ground. In the example, a potentiometer sets how many segments are lit.
Pins
| Pin | What it is |
|---|---|
| 1 | signal — wire it to a GPIO of the board |
| 2 | signal — wire it to a GPIO of the board |
| 3 | signal — wire it to a GPIO of the board |
| 4 | signal — wire it to a GPIO of the board |
| 5 | signal — wire it to a GPIO of the board |
| 6 | signal — wire it to a GPIO of the board |
| 7 | signal — wire it to a GPIO of the board |
| 8 | signal — wire it to a GPIO of the board |
| GND | common ground of all segments — to a GND symbol |
Wiring
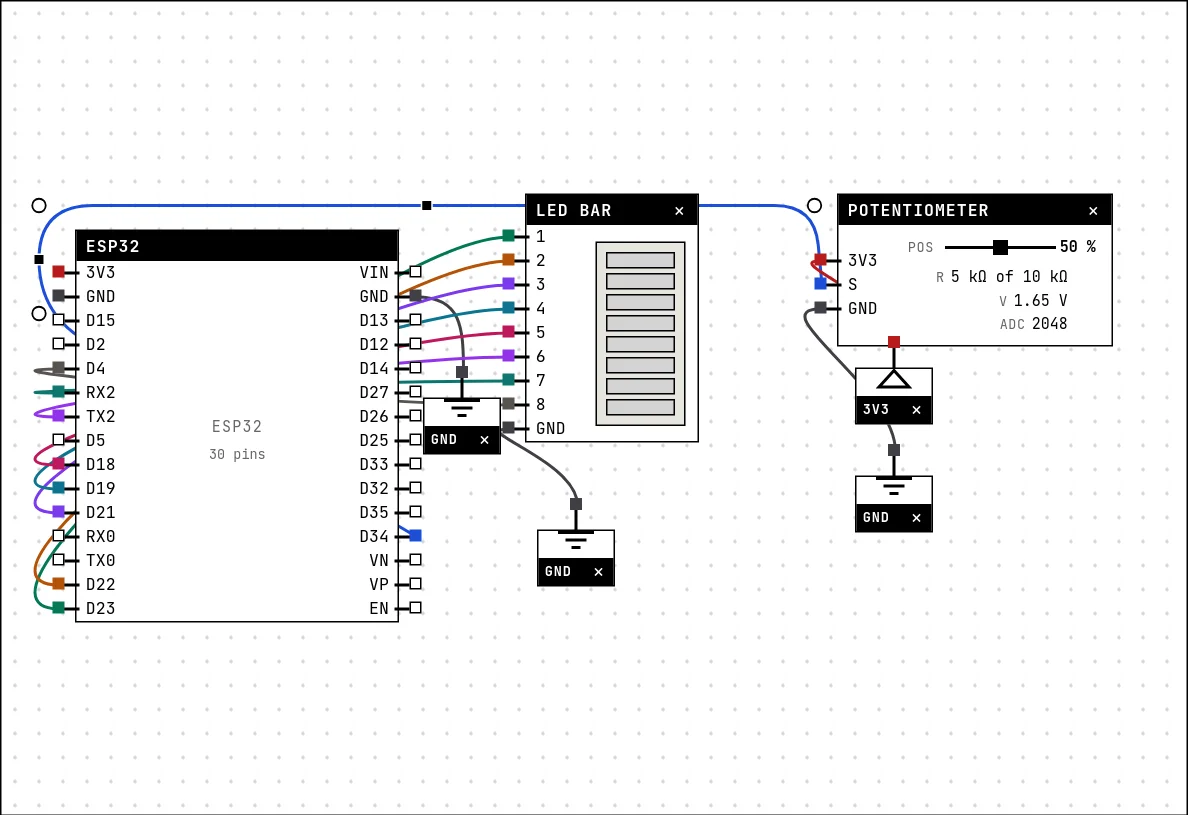
The circuit below is the example LED bar — level meter from the lab — open it with Project → Open example… and it comes ready to run.
| LED bar pin | Goes to |
|---|---|
| 1 | D23 on the board (GPIO 23) |
| 2 | D22 on the board (GPIO 22) |
| 3 | D21 on the board (GPIO 21) |
| 4 | D19 on the board (GPIO 19) |
| 5 | D18 on the board (GPIO 18) |
| 6 | TX2 on the board (GPIO 17) |
| 7 | RX2 on the board (GPIO 16) |
| 8 | D4 on the board (GPIO 4) |
| GND | a GND symbol |
Eight wires that do not cross: the sketch lists the GPIOs in the physical order of the board's right header (23, 22, 21, 19, 18, 17, 16, 4), so segment 1 sits level with the first pin. Out of order the circuit still works — the drawing just turns into a tangle.
Settings
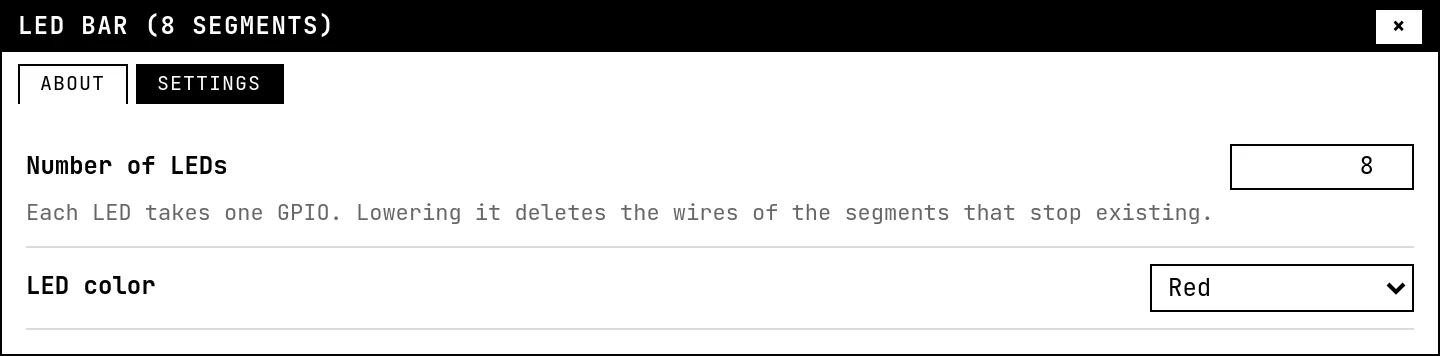
Double-click the block's title bar to open its card, then the Settings tab. Changes apply to the running simulation right away.
| Setting | Accepts | Default | Notes |
|---|---|---|---|
| Number of LEDs | 2 to 16 | 8 | Each LED takes one GPIO. Lowering it deletes the wires of the segments that stop existing. |
| LED color | Red · Green · Blue · Yellow · Orange · White | Red |
Code
#include <Arduino.h>

// GPIOs in the SAME physical order they appear on the right header of the
// board (top to bottom). That way segment 1 of the bar sits level with the
// first pin, 2 with the second, and the eight wires run straight without
// crossing. Out of order the circuit still works, but the drawing turns into
// a tangle — and reading the schematic is half of the learning.
const int LEDS[8] = {23, 22, 21, 19, 18, 17, 16, 4};
const int POT = 34;

void setup() {
  Serial.begin(115200);
  for (int pino : LEDS) pinMode(pino, OUTPUT);
}

void loop() {
  int leitura = analogRead(POT);
  int acesos = map(leitura, 0, 4095, 0, 9);   // 0..8 LEDs

  for (int i = 0; i < 8; i++)
    digitalWrite(LEDS[i], i < acesos ? HIGH : LOW);

  Serial.printf("pot=%d LEDs on=%d\n", leitura, acesos);
  delay(60);
}
An array of pins and a loop: map() turns the reading (0 to 4095) into a count of lit segments (0 to 8), and each digitalWrite lights a segment if its index is below the count.
Run it
Press Build and run. The first build of a project takes a while; after that, only what changed is rebuilt.
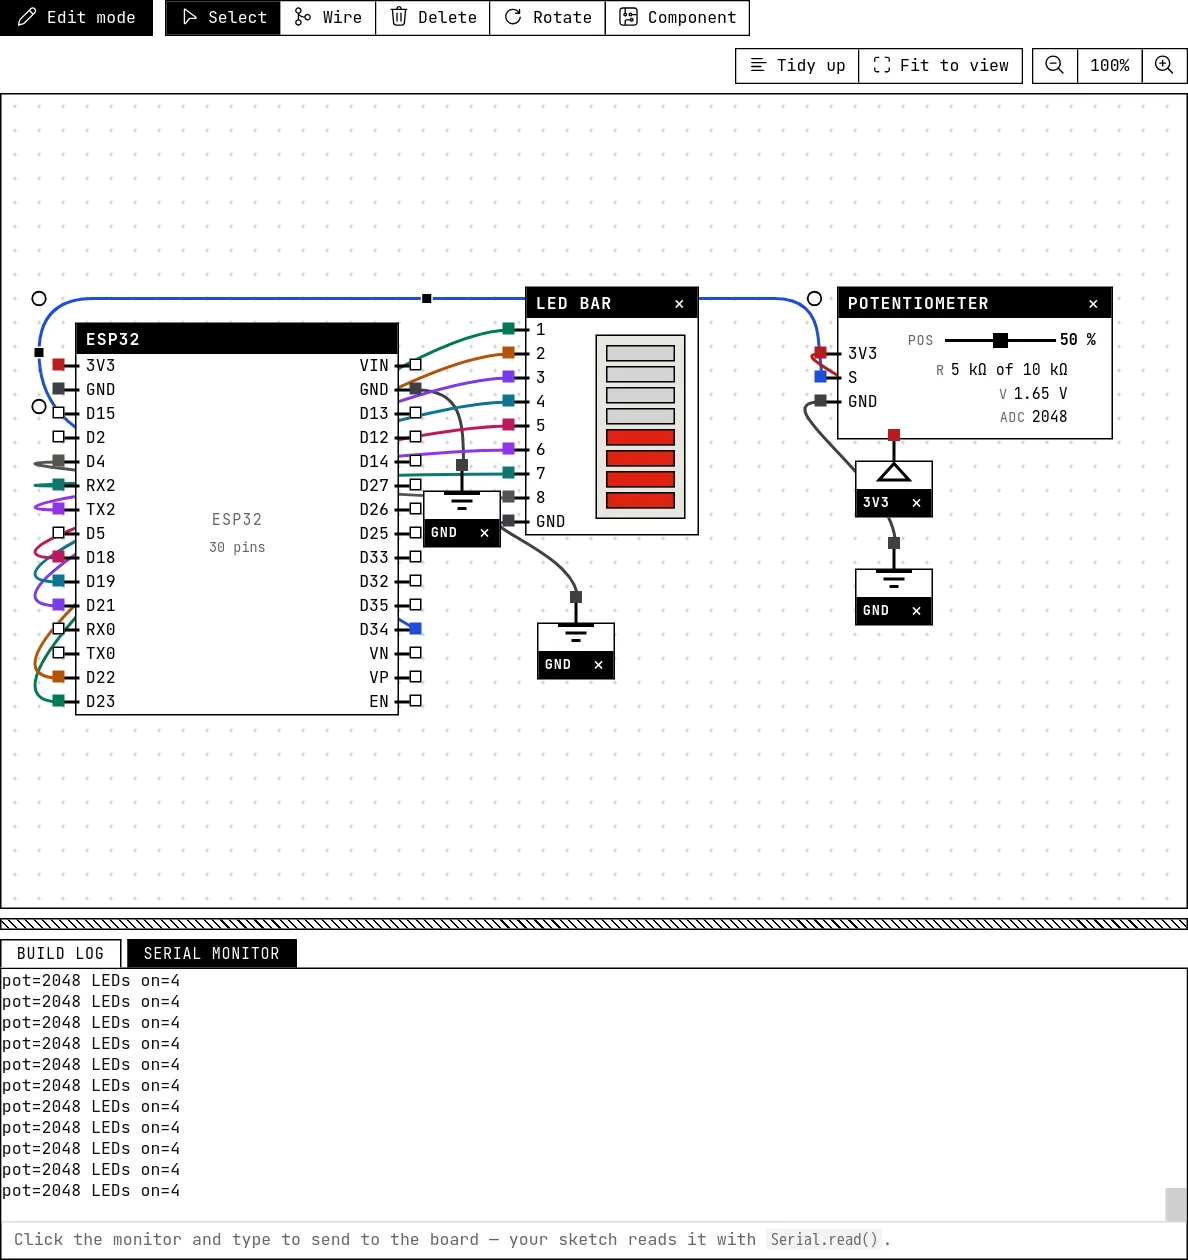
Drag the potentiometer's slider from 0 to 100 % and the bar climbs from empty to full. The serial monitor prints the reading and the count.
How the simulation models it
- Each segment follows the level of its own GPIO — a segment with no wire stays off.
- Lowering the number of LEDs in Settings deletes the wires of the segments that stop existing.
- Brightness (PWM) is not modeled; segments are on or off.
Try this
- Turn it into a “dot” meter: light only the segment at the level, not all the ones below it.
- Make the top two segments blink when the reading passes 90 % — a peak warning.
See also
- LED — The first output of every project: a GPIO set HIGH lights it, LOW turns it off.
- Potentiometer — A variable resistor whose wiper divides 3.3 V — the first analog input, read with analogRead().