Tutorials / Getting started
A tour of the lab
Every area of the screen and what it is for: the top bar, the files and the editor, the canvas and its toolbar, the output panel, and the datasheet card.
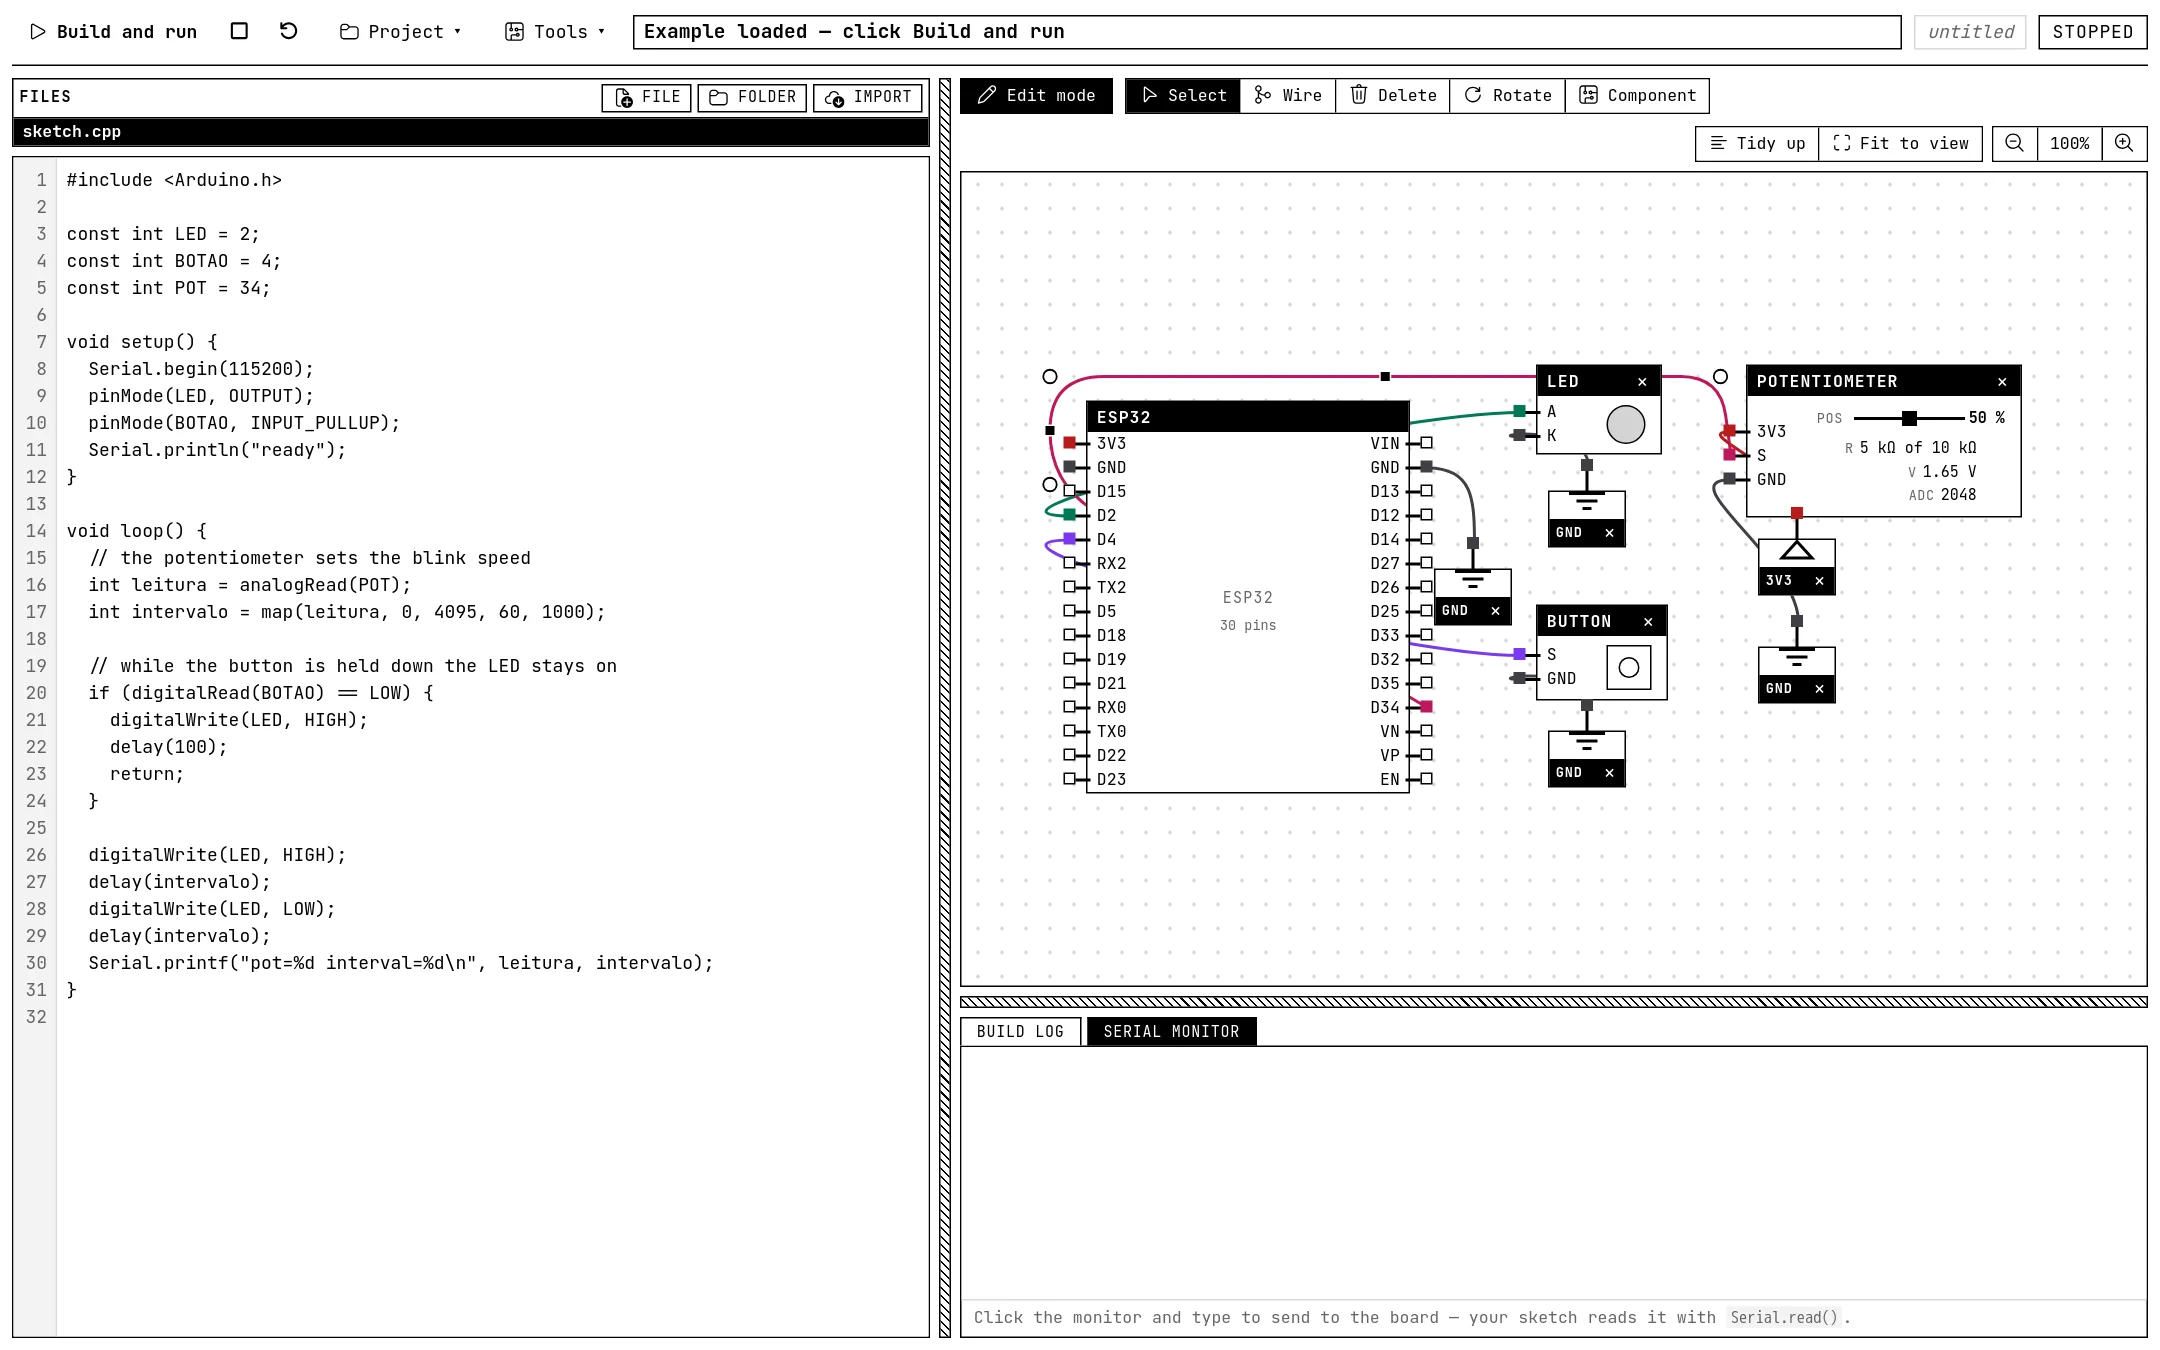
The top bar

- Build and run compiles the code and starts the simulation. The two icon buttons next to it stop the simulation and restart the firmware without rebuilding (the chip reboots, like pressing the reset button on a board).
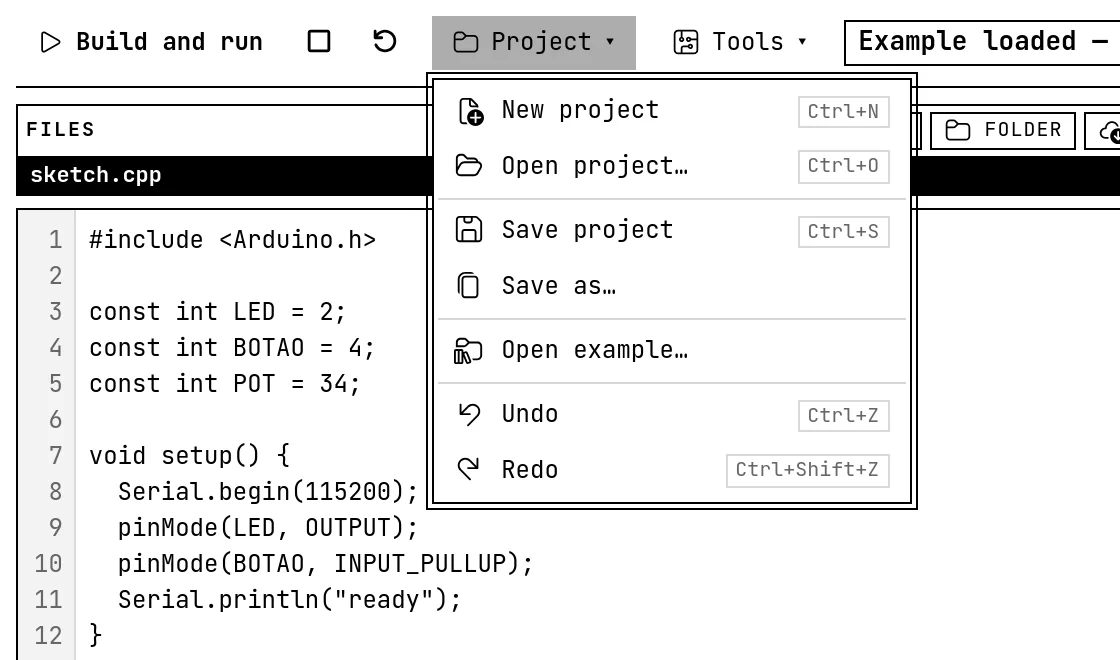
- Project holds everything about the project as a whole: new, open, save, save as, the examples gallery, undo and redo.
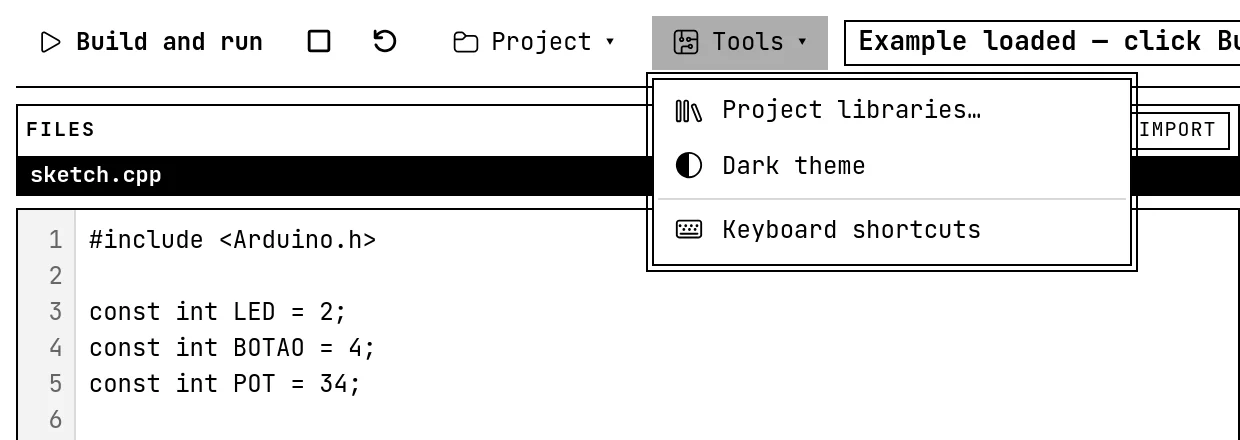
- Tools holds the project libraries, the light/dark theme and the list of keyboard shortcuts.
- The wide box in the middle is where the lab talks to you: “Example loaded — click Build and run”, warnings about a pin that is not wired, and so on.
- On the right, the project name (double-click it to rename) and the status: Disconnected, Connected, Building, Queued, Starting, Running, Stopped.
Files and the editor

A project is a set of .cpp and .h files. Most start with a single sketch.cpp, and that is fine; bigger ones grow folders. The three small buttons create a file (type a path with slashes, like lib/motor.cpp, to create the folder at the same time), a folder, or import a whole folder from your computer. Renaming and deleting are on each row of the tree.
The editor is deliberately plain: line numbers, Tab to indent (select several lines to indent them together; Esc then Tab leaves the field for keyboard users), and Ctrl+Enter to build and run. When a build fails, the offending lines are marked in red on the line ruler — clicking an error in the build log jumps to it.
The canvas and its toolbar

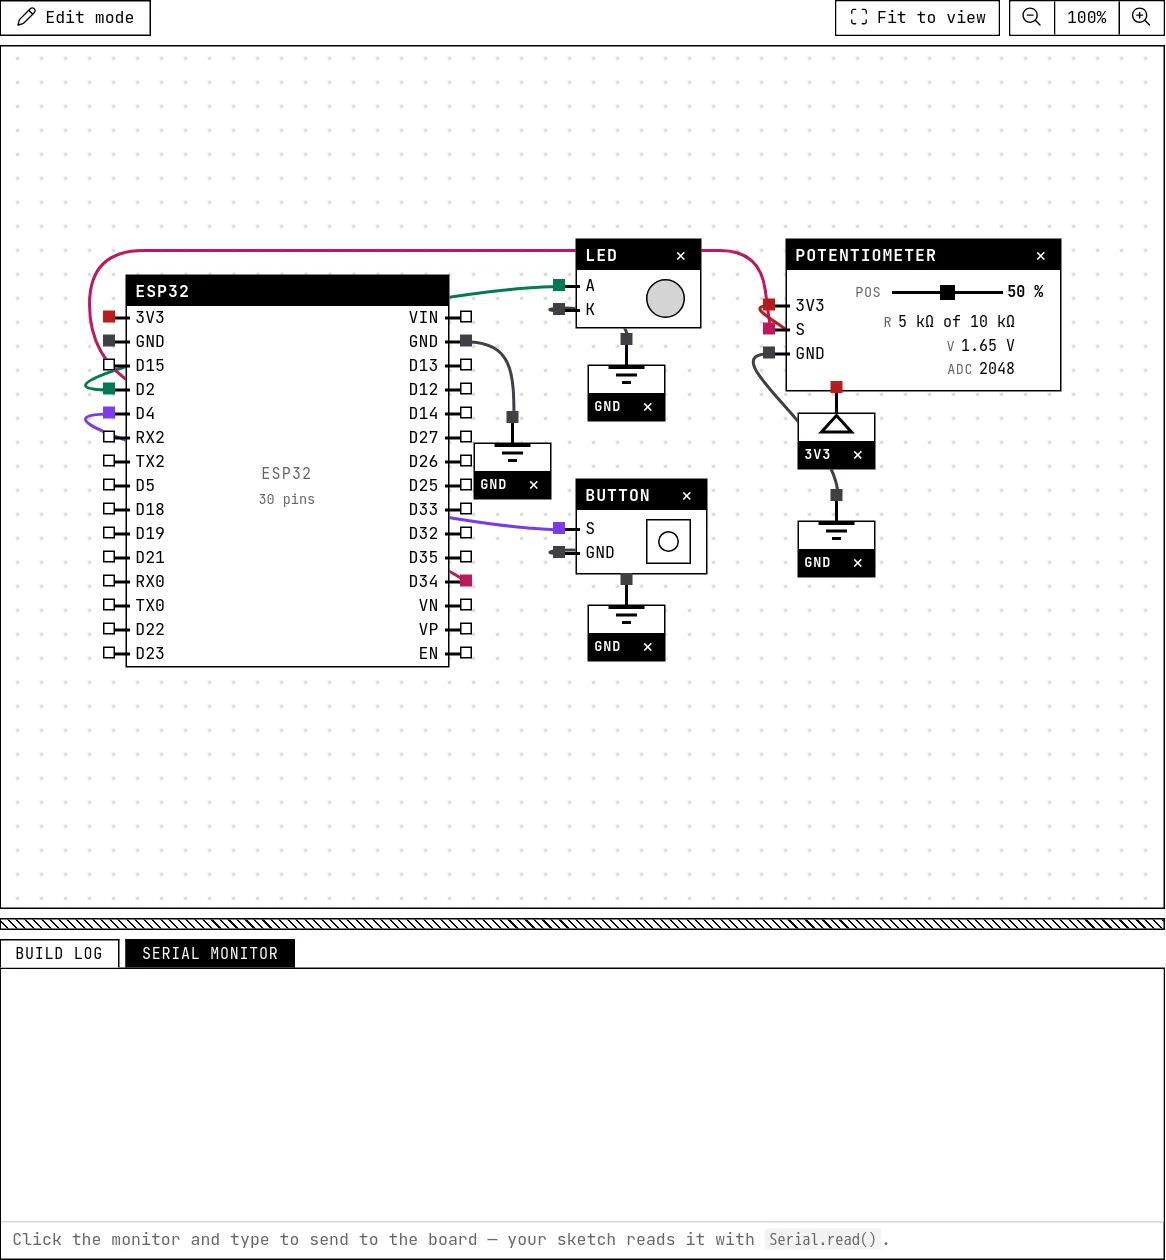
- Edit mode is on by default. Turn it off and the canvas becomes read-only: no handles, no accidental moves — but the parts still work (you can still press a button or drag a slider).
- The palette: Select moves blocks and pans the background; Wire draws wires; Delete removes what you click; Rotate turns a block 90° per click (hold Shift for the other direction); Component opens the catalog.
- Tidy up re-arranges the modules on both sides of the board in the order of the pins they connect to. Fit to view frames the whole project (double-clicking the middle mouse button does the same).
- The mouse wheel zooms around the cursor; dragging the background pans. The zoom percentage button returns to 100 %.
The output panel
Two tabs. Serial monitor shows what the firmware prints and sends what you type to it (see The serial monitor). Build log shows the compiler's output, kept from one run to the next; errors and warnings in it are clickable.
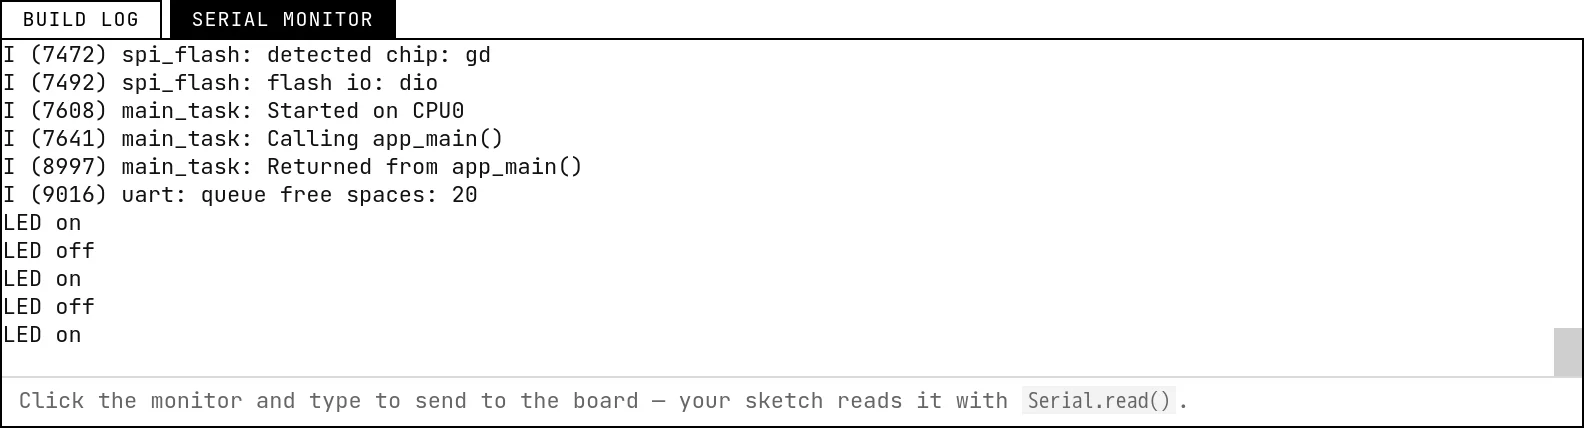
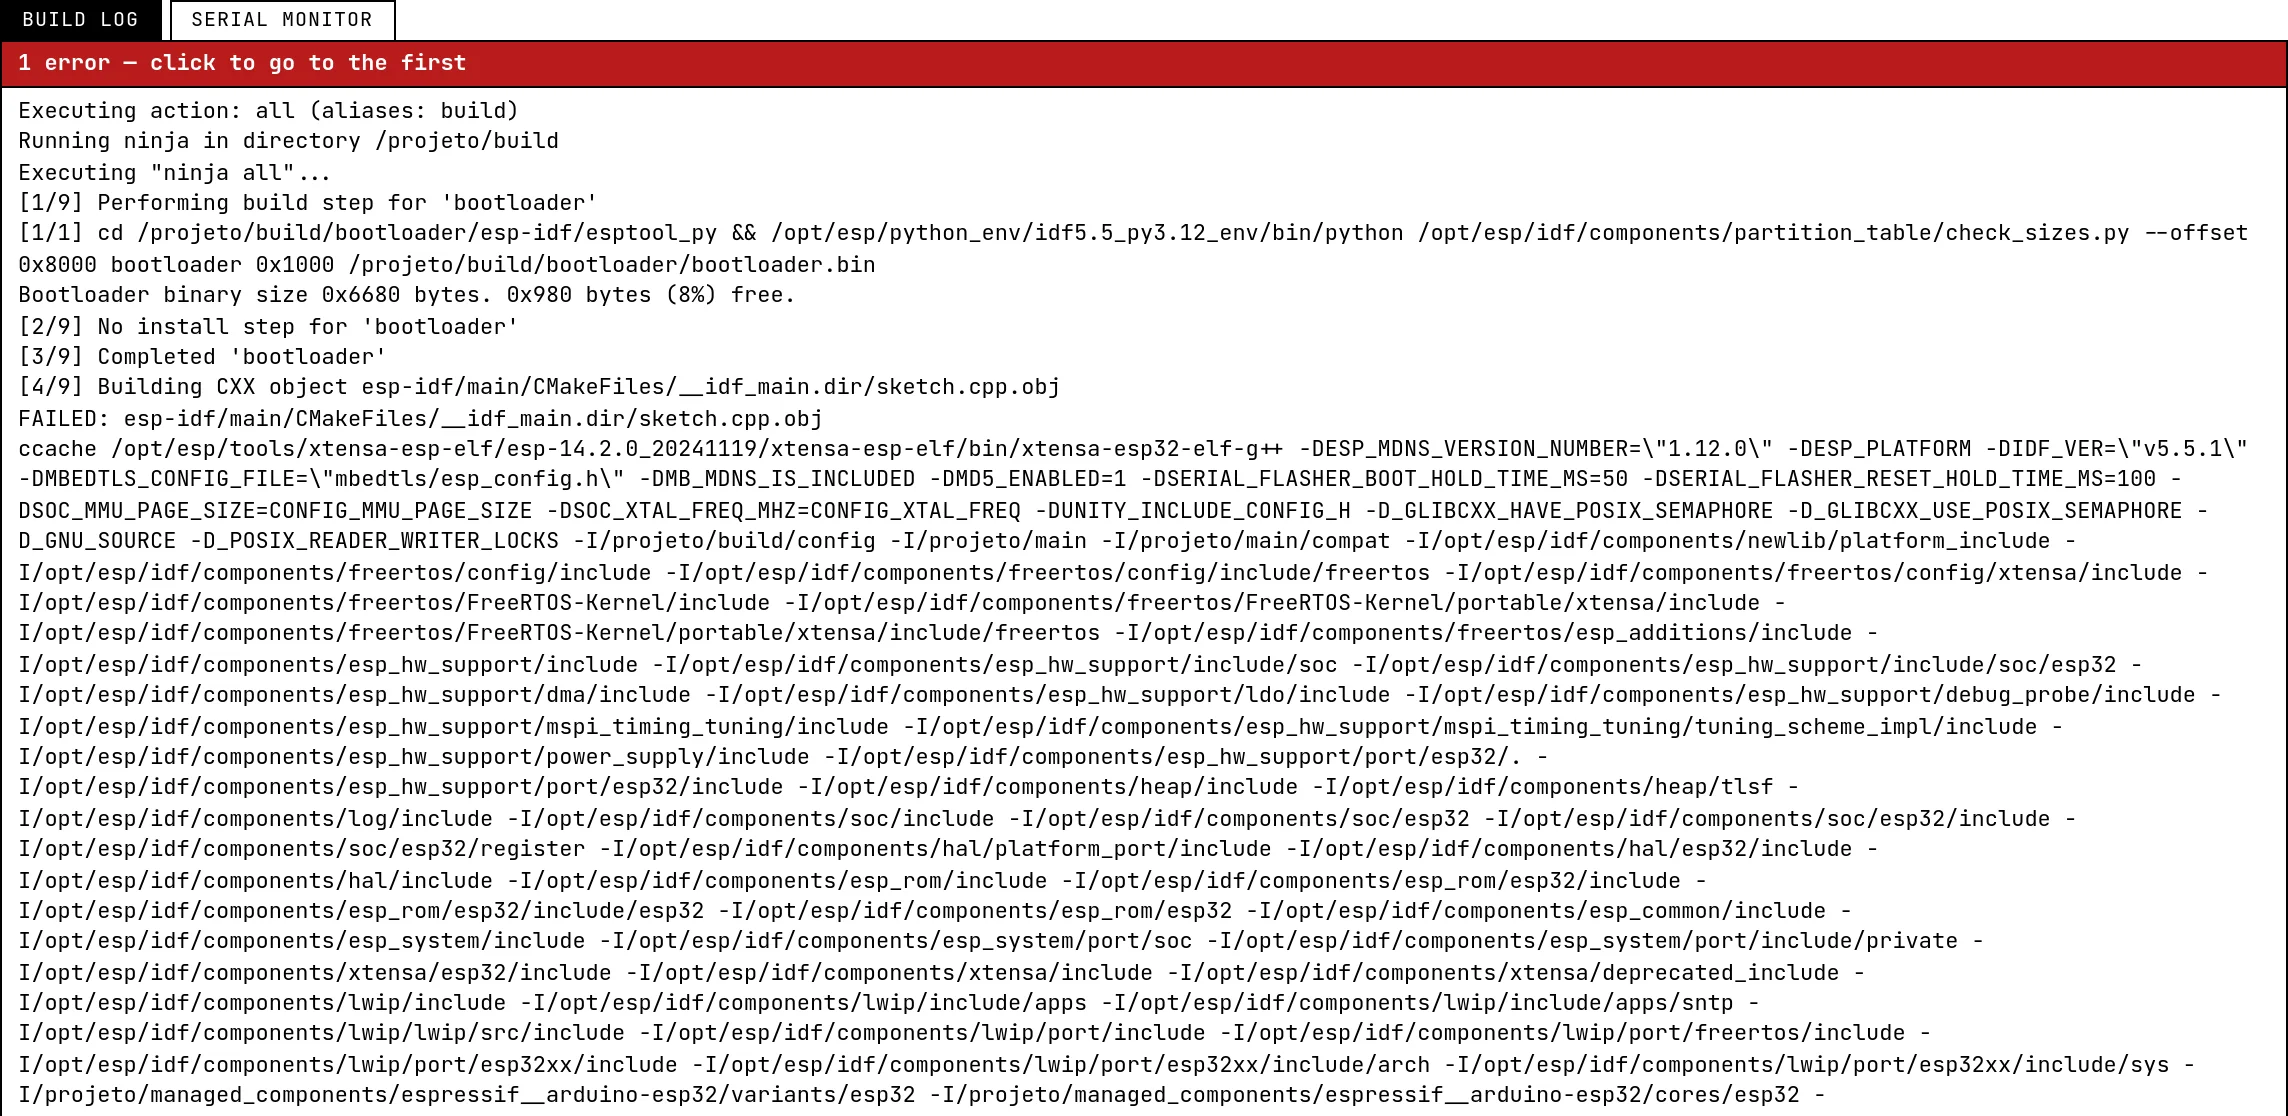
The bar between the canvas and the panel — and the one between the editor and the canvas — can be dragged to resize.
The datasheet card
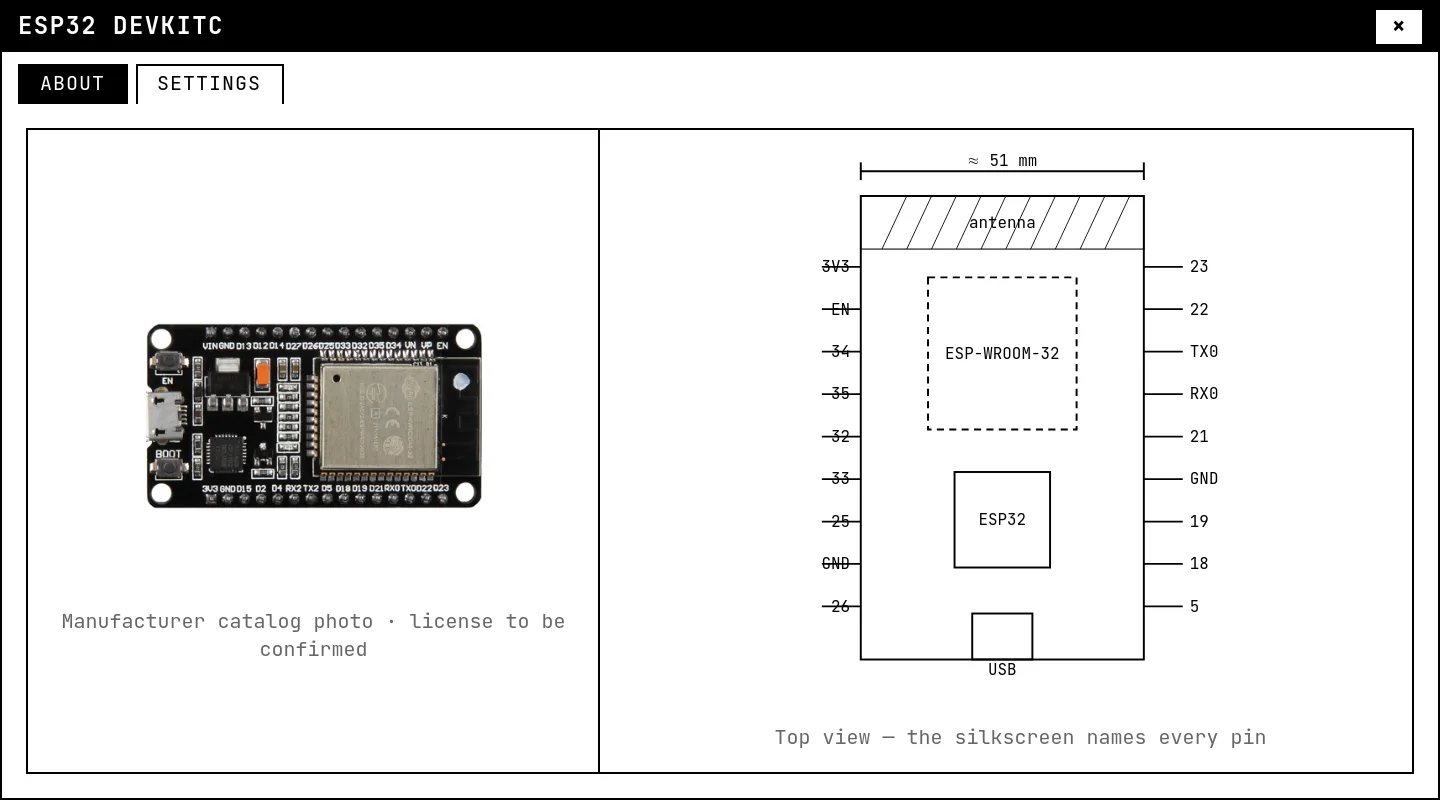
Double-click the title bar of any block and its card opens. The About tab shows the part (a photo or its schematic symbol); the Settings tab holds everything adjustable about it — the color of an LED, the address of an I²C module, the resistance of a potentiometer. Settings change the running simulation immediately.

Theme and shortcuts
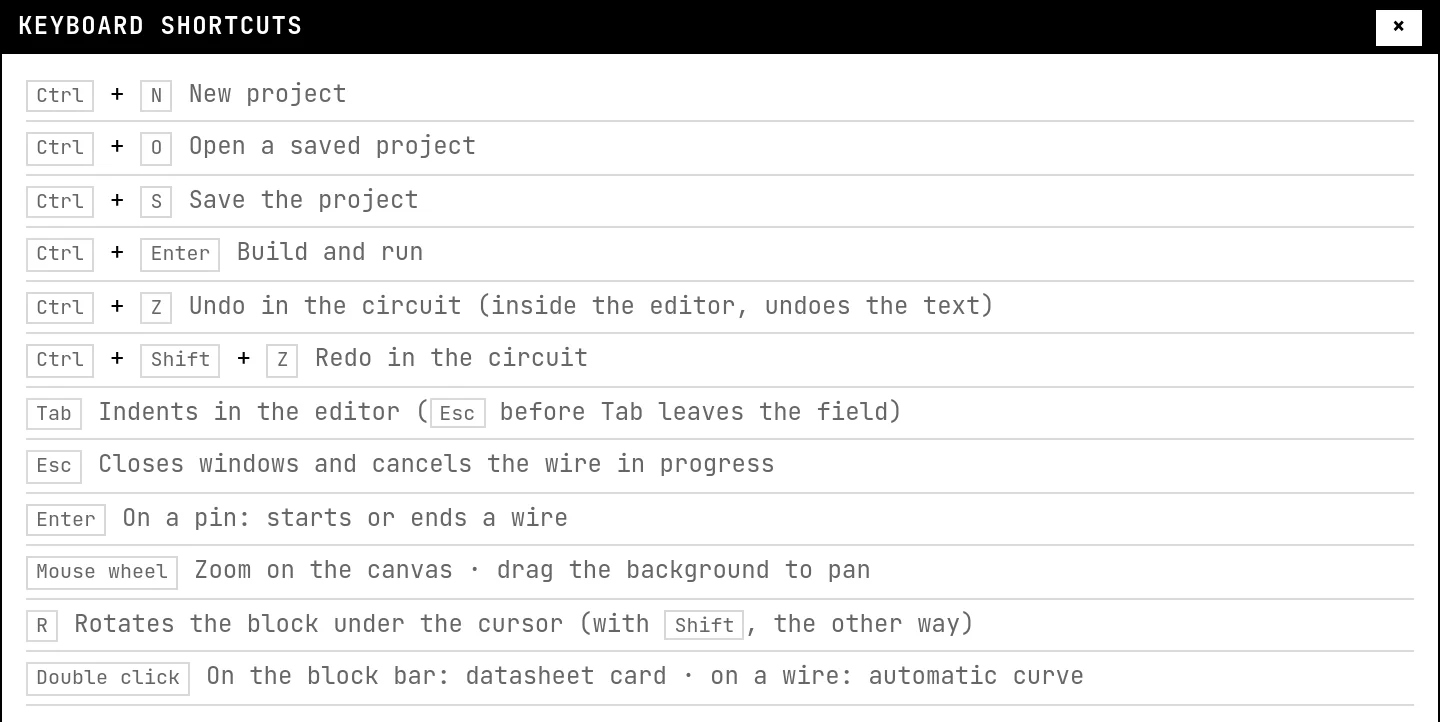
Tools → Dark theme switches the lab to dark; the choice is remembered, and the site follows it. Tools → Keyboard shortcuts lists every shortcut in one place:
See also
- Your first circuit: blink an LED — From an empty canvas to a blinking LED — placing a part, drawing wires, writing the code, saving and running. Ten minutes, and you will have used every part of the lab once.
- Placing parts and wiring — The catalog, the Wire tool, junctions and free tracks, nets and their colors, the ground and power symbols, and the tools that move, rotate and delete.
- Build, run and read the log — What happens when you press Build and run, the states of the simulation, the build log and its clickable errors, stop and restart, and why a build can wait in a queue.